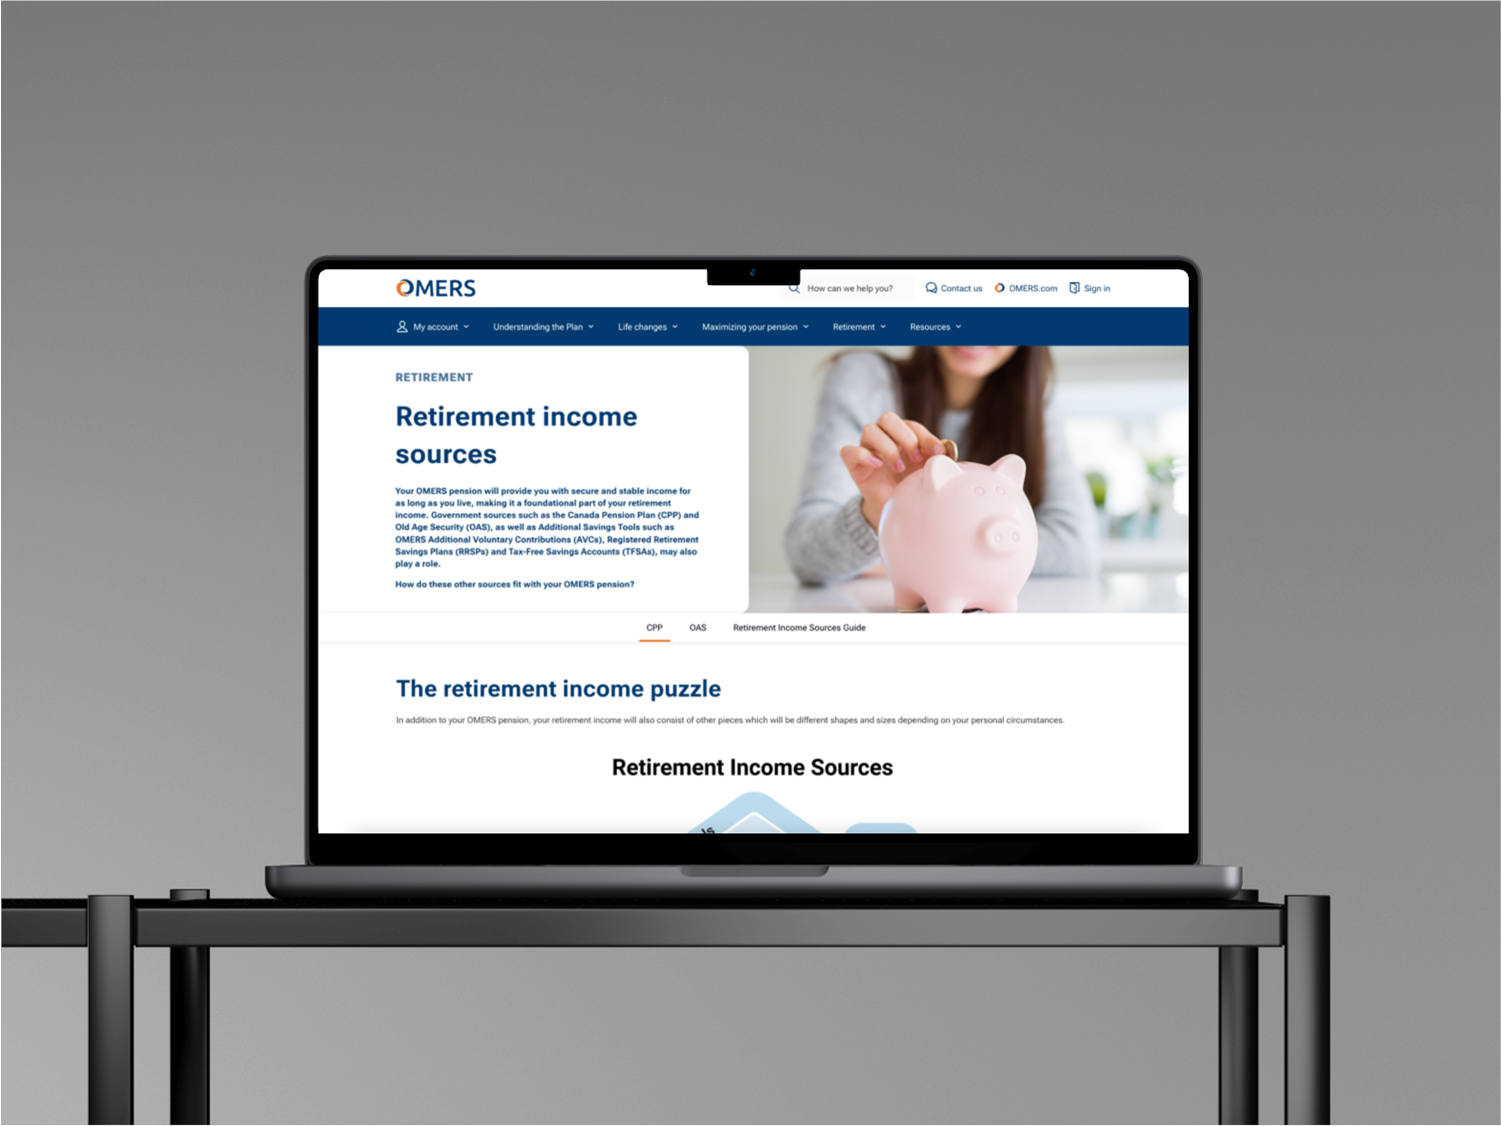
OMERS (Ontario Municipal Employees Retirement System) is one of Canada’s largest defined benefit pension plans that provides retirement income for municipal employees. Plan administrators are responsible to provide updates about employees’ work status, salary, leaves of absence, ect. to accurately calculate pension benefits all.
Currently, updates on employees’ status are delivered only once per year by mail, creating delays, inefficiencies, and potential errors in payroll and reporting.
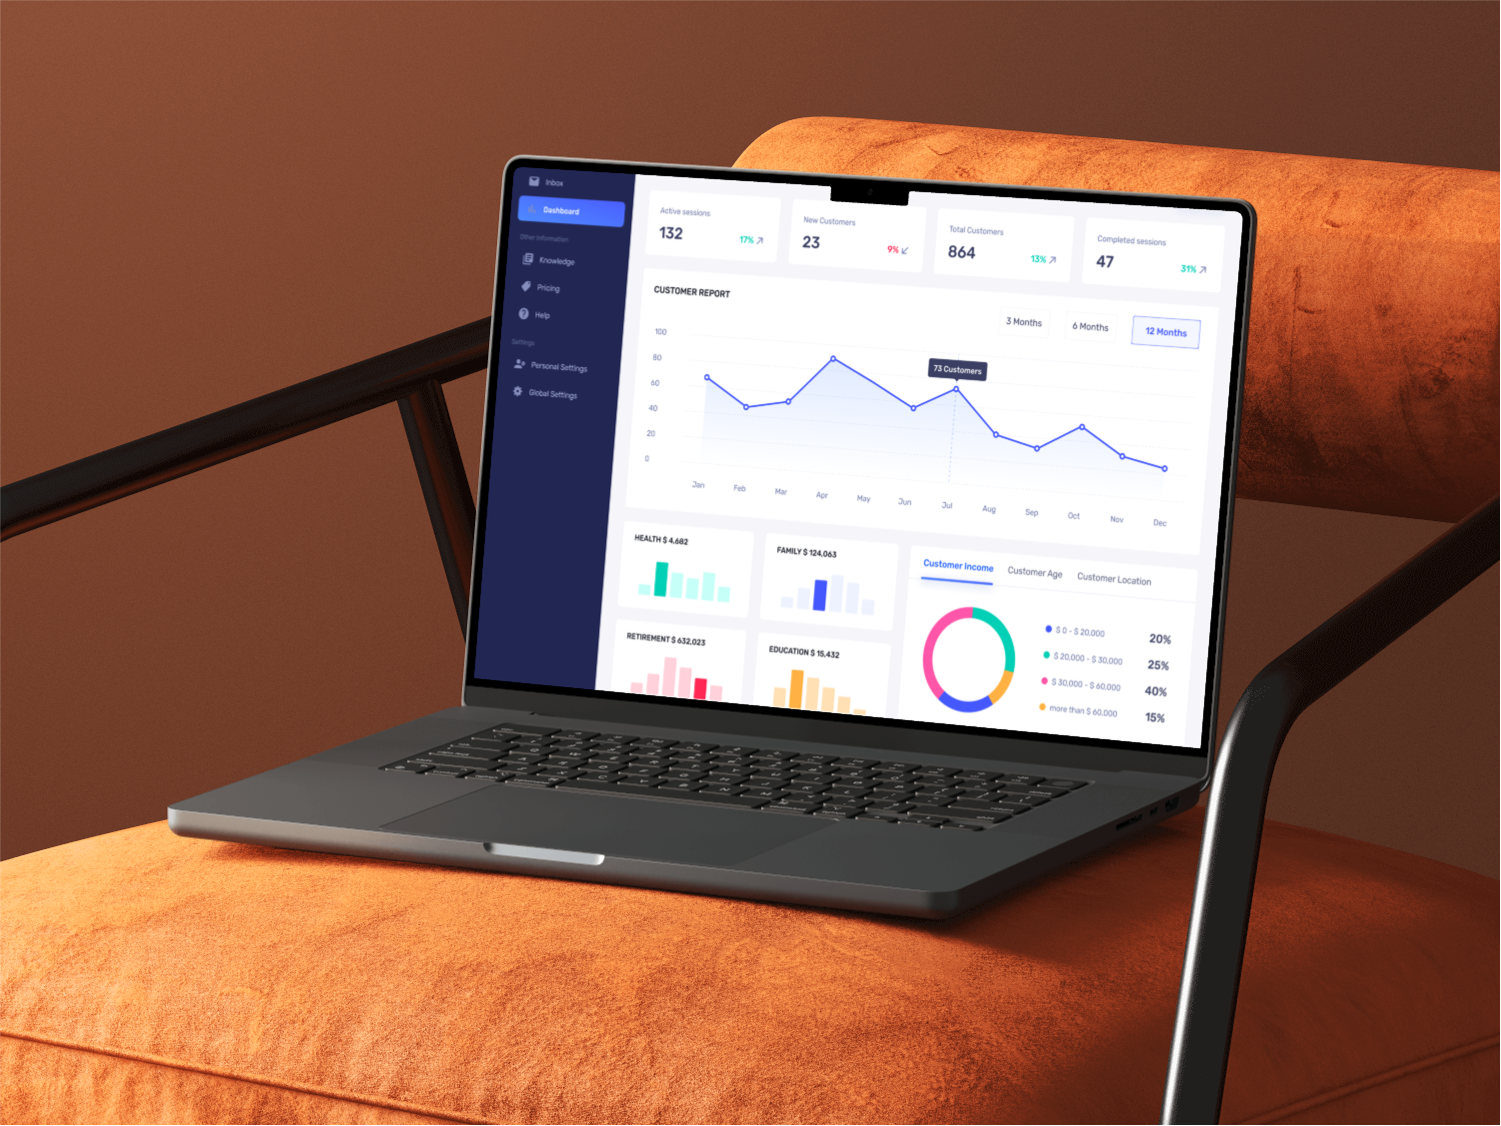
To address this, the product team proposed a real-time dashboard that would allow administrators to monitor employee status in real time, improving workflow and reducing manual tracking.
As a UX Researcher, I partnered with a Lead UX Researcher, and collaborated with the Product Owner to ensure the dashboard met administrators’ needs. The priority for the study was to:
During the intake meeting with the Product Owner, we defined research goals, clarified key features, and aligned on success criteria for the dashboard. We discussed the target users, workflows, and current pain points, which helped inform participant recruitment and task design.
Given that the product was still in development, we agreed that moderated prototype testing would provide the best opportunity to evaluate early usability, validate task flows, and gather actionable feedback before development.
Working alongside a Senior UX Designer, we reviewed and approved the prototype design to ensure it reflected intended task-flows and functionality before testing.
To ensure our study reflected the diversity of users and workflows, we recruited 8 plan administrators from small, medium, and large organizations. Participants were selected to represent a range of experience levels and organizational contexts, capturing how different administrators interact with the dashboard.
We conducted recruitment through targeted email outreach, inviting eligible administrators to participate in 60-minute moderated sessions. This approach allowed us to efficiently reach the right audience while ensuring participants were familiar with the tasks and challenges relevant to their daily workflows.
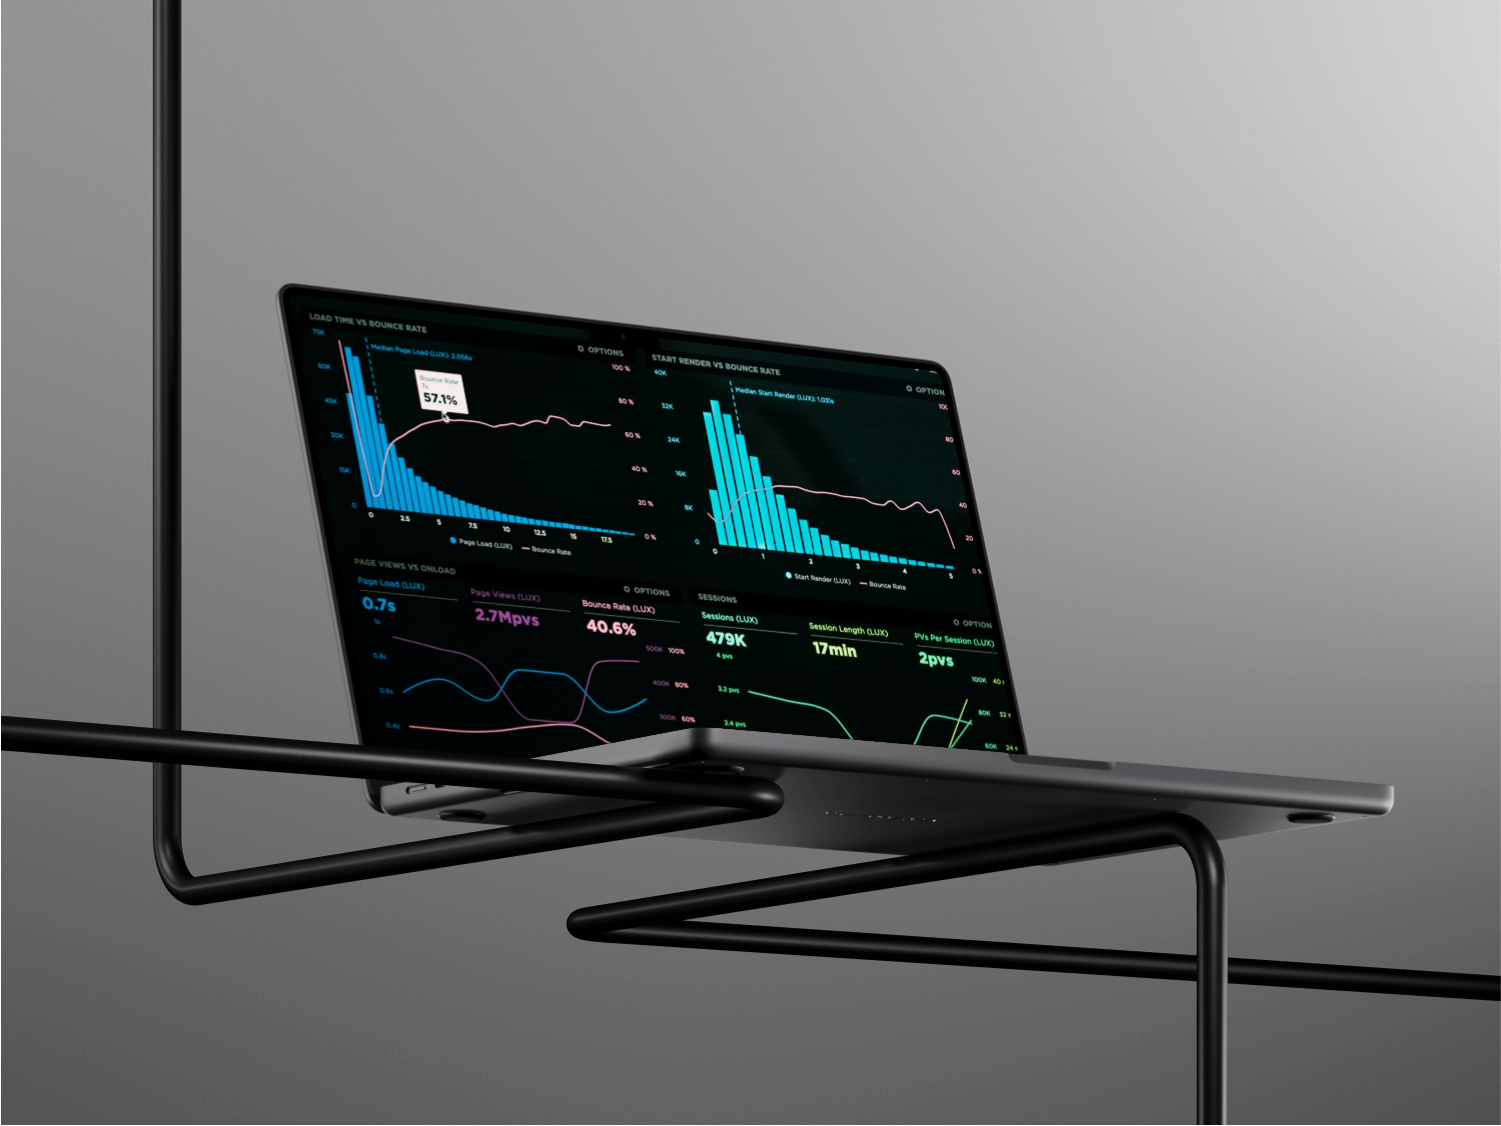
Over a four-day period, we conducted eight 60-minute moderated sessions. To create a realistic and engaging experience, participants interacted with an interactive Figma prototype of the dashboard, which simulated real-time updates and key functionalities. We alternated roles, and while one researcher facilitated, the other took detailed notes and captured observations.
We alternated research roles throughout the sessions, and while one researcher facilitated the session guiding participants through tasks, and asking follow-up question, the other took detailed notes, observations, and non-verbal cues.
Participants completed a series of structured tasks aligned with real administrative workflows, including reviewing employee status, interpreting dashboard information, and navigating key tabs.
Overall, participants found the dashboard helpful, appreciating the ability to access real-time data. However, the study highlighted areas that needed improvement:
Based on the insights, we proposed several targeted recommendations to improve overall usability:
The study resulted in a UX report that summarized our key findings and provided actionable recommendations for the dashboard design. During a live shareback session, we presented these insights to stakeholders, walked them through the recommendations, and facilitated a discussion to explore their perspectives, clarify questions, and align on next steps.
Although the product has not yet launched, stakeholders expressed high confidence that these results are actionable, and ultimately will enhance usability, and user satisfaction.